Here below are energy charts for today.
Each of them show unusual energy patterns.
It's all building up to something. To what is the question.
These energy meters are going bonkers, I 've never seen them like that and I speak for all of them.
Moreover I haven't even included the Kiruna or Lycksele meters nor the Sun graphs.
They all have 1 thing in common: weirdness.
Today is 20/02/2020.
Press play on the video below.

See those purple lines going down all the time? That's unusual.
Normally if there's activity, all the lines are blurred together. Since a week or 2 the yellow line on top is not involved and the others dive deep instead of mingling.

See those black lines? I've never seen them until they started showing up 2 weeks ago. Now they're here almost every day.

This meter is normally black.
Now it is completely purple.
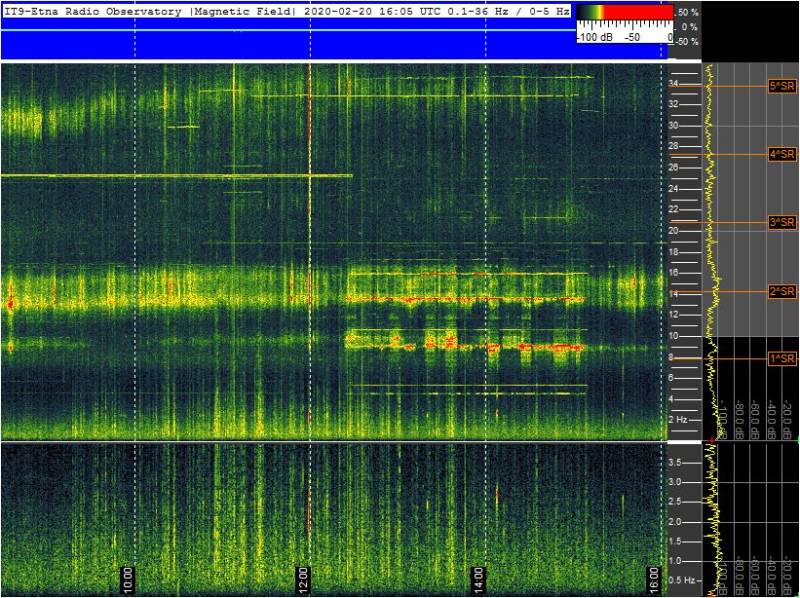
See those red horizontal dots/lines? They normally aren't there.

See those yellow/green spikes? They normally aren't there.

Last but not least, the Schumann graph in Tomsk, Russia.
As you may know, the meter is upside down. So below is actually a high value.
Whenever there's deep red in that chart, it hurts.
It directly and deeply affects our central nervous system.
bron: www.atian.be
Published on 20 February 2020 at 17:49